Subtitle if this were an academic paper, which it’s not: A k-means clustering derived point statistic highly correlated with regressions in commit-series data with applications to automatic anomaly detection in large sets of benchmark results.
TL;DR: To detect regressions in benchmark data over a series of commits use k-means clustering on mean and variance normed commit-series. For each of the clusters find the best fitting step function to each cluster’s centroid. The metric |step/fit| is highly correlated with regressions, where step is the height of the step function, and fit is the mean square error of the fit of the step function to the centroid.
Below is the description of how we detect performance regression for the Skia graphics library. I’m writing this up because after much searching I haven’t found anyone describe the method we came up with for detecting performance regressions and maybe this writeup will be useful to other people.
Problem Statement
Skia is an open source cross platform 2D graphics library. In Skia, like many other software projects, we have large number of performance tests, aka benchmarks, and we run those benchmarks every time we change the code. Just having a large number of benchmarks isn’t a problem, but being cross platform means running those tests across many different platforms; Linux, Mac, Windows, Android, ChromeOS, on different GPUs, etc. which leads to a combinatorial explosion in benchmark results. For every commit to Skia today the testing infrastructure generates approximately 40,000 benchmark measurements. That number of results tends to change frequently as tests, platforms, and configurations are added and removed regularly. The number of results has been over 70,000 per commit in the past several months.
Definitions
To make the following discussion easier let’s define some terms.
- Trace
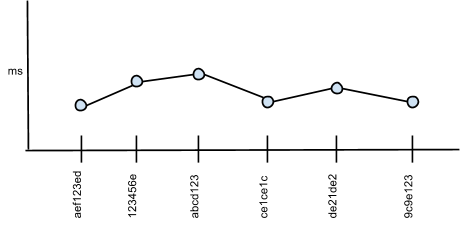
- A Trace is single benchmark and configuration tracked over a series of commits. Note that this isn’t exactly a time series since the measurements aren’t taken at equidistant times, but are spaced by commits to the codebase. Also note that for each benchmark there may be multiple traces, for example, one for Windows 8, one for Linux, and one for Android.
Fig 1 - Trace
- Regression
- A “performance regression” is a significant change in either direction of a metric. Now a metric that drops may actually be a good performance increase, but could also be an indication of a test that is broken, or has stopped working entirely. So regardless of the benchmark, we are looking for step-like changes in either direction.
The issue with tens of thousands of traces is that you just can’t look at the raw numbers, or even plot all the data, and figure out when you’ve had a regression. At first we tried setting performance ranges for each trace, i.e. an upper and lower bound for each trace. If a later commit caused the benchmark results to move outside those bounds then that would trigger an error. There are many drawbacks to monitoring benchmarks by manually placing bounds on each trace:
- The most important drawback is that in such a system a single test result can trigger an alert. You know old phrase, “the plural of anecdote isn't data”, a single benchmark measurement is virtually meaningless as any number of anomalies could actually be responsible for that benchmark result changing. For example, a machine could overheat forcing a move to frequency scaling, or other processes on the machine may starve the test of CPU cycles. You can work to mitigate these eventualities, but they never completely go away. SPC systems such as the Western Electric rules might be applicable in this case, but we’ve never tested them.
- Constant manual editing of trace bounds is time consuming and error prone.
- Constantly adding manual trace bounds for new benchmarks is time consuming. Add one test and you may have to add many trace bounds, one for each member of that combinatorial explosion.
- Forgetting to add new ranges for new benchmarks another source of error.
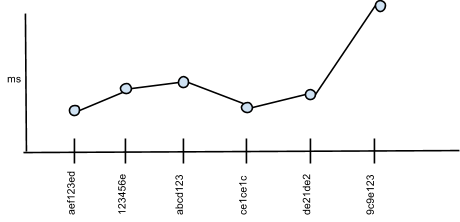
Even if you automate the placing of trace bounds, you still have the issue of transient behavior that looks like a regression, and you also have to take pains that the automatic calculation of trace bounds doesn’t mask a true regression.
Fig 2- Is this a regression or an anomaly?
So we needed a better system than setting trace bounds. The next section explains the system we implemented and have successfully run for several months now.
Before we go further let’s define a few more terms.
- Normalized Traces
- Normalization is the process of modifying each Trace so that it has a mean of zero and a standard deviation of 1.0. Note that if the standard deviation of a trace is too small, then blowing that up to a standard deviation of 1.0 would introduce nothing but noise, so there’s a lower limit for the standard deviation of a trace, and below that we don’t normalize the standard deviation of the trace. The idea is to extract just the shape of the trace, so that all the normalized traces are comparable using a sum of squares distance metric. The smaller the sum of squares error is between two normalized trace, the more similar their shapes.
- k-means clustering
- I’m not going to explain k-means clustering in one paragraph, you should go look it up on Wikipedia or any of the fine explanations available on the web. The important point is that we are using k-means clustering to group normalized traces together based on their shape. The idea is that many traces will move together in the same direction from commit to commit. For example, if I speed up rectangle drawing then all tests that use rectangles should get faster, if not in the same proportion.
- Centroid
- The centroid is the center point at the center of a cluster. In this case the mean of the normalized traces in a cluster, which acts as a prototype shape for the members of the cluster.
- Regression Factor
-
For each cluster of normalized traces we find the best fitting step function to the centroid. From that best fitting step function we calculate Fit and Step, where Fit is the sum of squares error between the step function and the centroid, and Step is the height of the step function.
From there we calculate the Regression Factor:
R = Step / FitA smaller Fit values gives you a larger R, which means that the more a centroid looks like step function the larger R gets. Similarly the larger Step gets the larger R gets, which is a measure of how big of a change the centroid represents.
Putting it all together.
So finally, with all the preliminaries set up, we can get to the core of the system.
- Collect all Traces over a specific range of commits. We usually use around the last 100-250 commits worth of data.
- Normalize all the Traces.
- Perform k-means clustering on all the Normalized Traces.
- For each cluster calculate the Regression Factor of the centroid.
- Any cluster with a Regression Factor whose absolute value is over 150 is considered interesting enough to need triaging. Note that 150 was chosen after observing the system in action for a while, the cutoff may be different for your data.
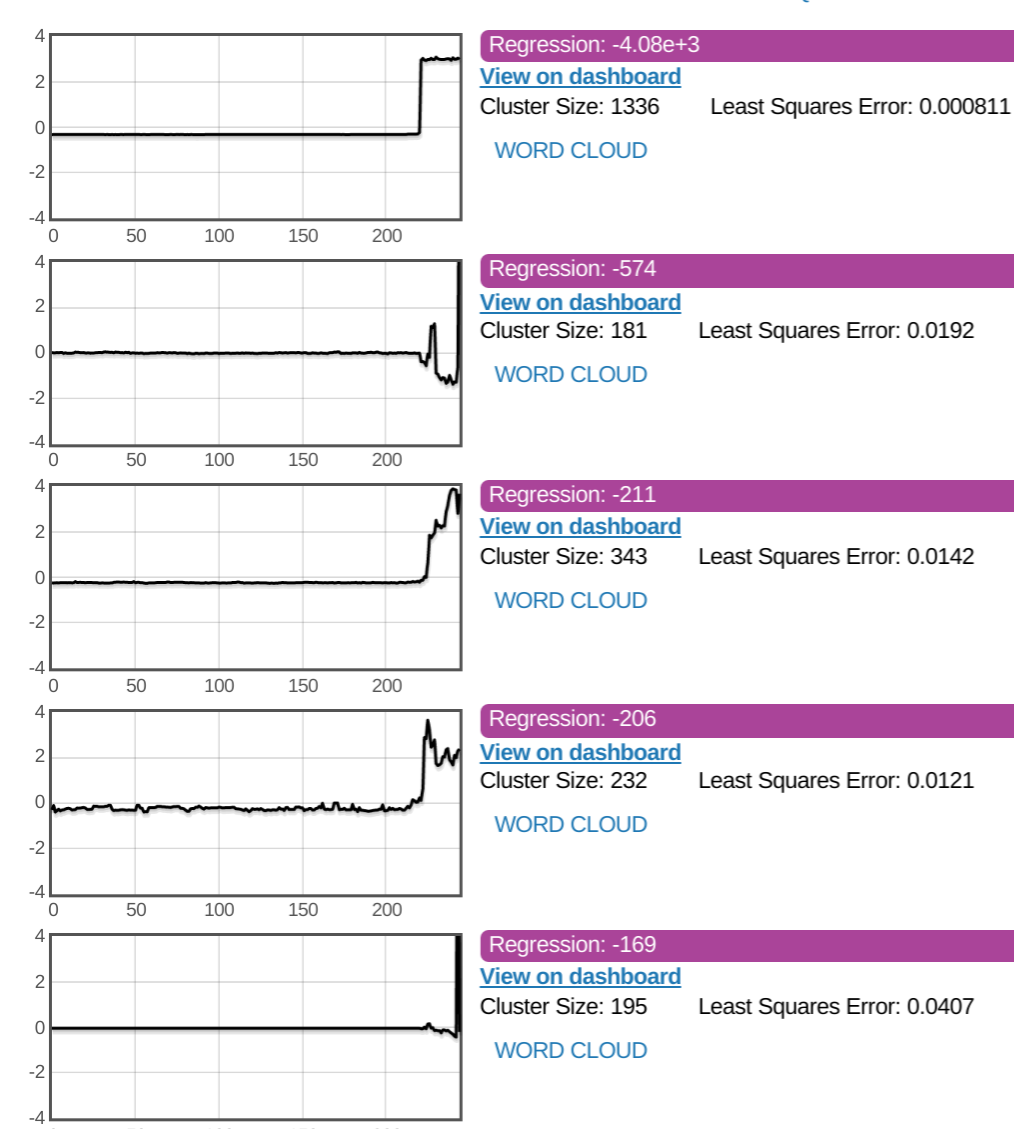
Here’s a view of the system at work, finding regressions in performance. Note that out of 40,000 benchmarks the first cluster contains 1336 traces and has a Regression Factor of -4.08e+3.
Continuous Analysis
The above system works for finding regressions once. But what happens if you want to check for regressions continuously as new commits land and new benchmark results arrive? One last definition:
- Interesting
- A cluster is considered interesting if it’s Regression Factor is over 150. This is only a rule of thumb based on observing the system and may be relevant only to the Skia benchmarks, while a different cutoff may be appropriate for other datasets. The important point in that as |R| grows so does the likelihood of that cluster being a regression.
To continuously monitor for Interesting clusters, start by running the above analysis once and find interesting clusters. If there are any then triage them as either really needing attention, such as a CL needs to be rolled back, or ignorable, say in the case where a true performance increase was seen. Then on a periodic basis run the analysis again when new data arrives. What should be done with the new set of interesting clusters produced from the analysis? The existing interesting clusters have already been triaged, and those same clusters may appear in the output of the analysis, and new interesting clusters may appear. The process of only raising up new interesting clusters for triaging while folding existing clusters with similar clusters that appear in the analysis results is called cluster coalescing.
Cluster coalescing currently works by looking at all the new interesting clusters and if they have the same traces as the 20 best traces in an existing cluster then they are considered the same cluster. Note that ‘best’ means the 20 traces that are closest to the centroid of a cluster. Note that this is an area of active work and we are still experimenting regularly with new cluster coalescing schemes.
Wrap Up
I hope that was useful. Please shoot me any questions on Twitter @bitworking. The code for the software that does the above analysis, and much more, is open sourced here.
 Joe Gregorio


